Time intelligence functions, part 02
- Marek Vavrovic
- Sep 24, 2021
- 2 min read
Updated: Sep 26, 2021
syntax
DATEADD(<dates>,<number_of_intervals>,<interval>)
Moves the given set of dates by a specified time interval.
Example 1
DATEADD
calculating Last month sales and variation.
LAST MONTH SALES
CALCULATE = (SUM(FactSales[Sales]),DATEADD(DimDates[Date],-1,MONTH))
Using month granularity. DATEADD(DimDates[Date],-1,MONTH)) shitted all the daily sales one month lower. If you would be using different granularity to display the data, you get a different result back

Example 1
DATEADD(DimDates[Date],-1,QUARTER)) is shifting the sales 1 quarter lower.

DATESBETWEEN
Returns the dates between two given dates.
syntax
DATESBETWEEN(<dates>, <start_date>, <end_date>)
Parameters
Term Definition
dates A date column.
start_date A date expression.
end_date A date expression.
Example
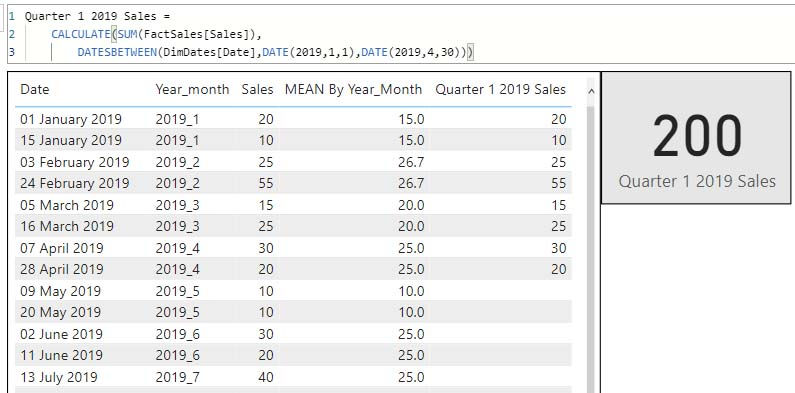
I want to display the Sales for the 1. quarter of 2019.
Quarter 1 2019 Sales = CALCULATE(SUM(FactSales[Sales]), DATESBETWEEN(DimDates[Date],DATE(2019,1,1),DATE(2019,4,30)))

Using variables

DATESINPERIOD
Returns the dates from the given period
syntax
DATESINPERIOD(<dates>, <start_date>, <number_of_intervals>, <interval>)
Example
The following expression evaluates the measure Sales Amount in the last 12 months starting from the last day of the period in the filter context.
two measures involved
1> Sales(YTD) = CALCULATE(SUM(FactSales[Sales]),DATESYTD(DimDates[Date]))
2> Sales Moving Annual Total =
CALCULATE (
[_Sales(YTD)],
DATESINPERIOD (
DimDates[Date],
MAX ( DimDates[Date] ),
-1,
YEAR))

Example
This measure start at 31.jun 2020, which is Quarte 2 2020 and goes back to Quarter 2 2019.

Example
Calculating 1 year moving average
1 year moving average = CALCULATE( AVERAGE(FactSales[Sales]), DATESINPERIOD(FactSales[Date],LASTDATE(FactSales[Date]),-1,YEAR))

DATESMTD
Returns a set of dates in the month up to the last date visible in the filter context
Cumulative total in each month.
syntax
DATESMTD(<dates>)
Example
DATEMTD creates a group by month and calculates the cumulative total. As I have just 2 records per month, using the dates from the fact table (picture 1) On picture 2 you can see how the data looks like if your fact table is really tiny. But this is not a real life scenario.

Example
Calculating the cumulative total in the month group and starting from the quarter 2.

Example
In this example I am retrieving the value of the DATESMTD function, the cumulative sum, on some specific date (15.jan.2019)
DATESMTD IS EQUAL TO DATE = CALCULATE( CALCULATE(SUM(FactSales[Sales]), DATESMTD(FactSales[Date])), FactSales[Date]=DATE(2019,1,15))

DATESYTD
Returns a set of dates in the year up to the last date visible in the filter context.
Example
calculate Cumulative running total for the sale column.

Example
I want to display the Sales starting from 1st of July 2021
Sales for Q3-Q4 =
SUMX (
CALCULATETABLE (
tblSales,
DATESYTD ( tblSales[Date] ),
tblSales[Date] = DATE (2021, 06, 31)
),
SUM ( tblSales[Sales] ))

Example
I want to overwrite the start of the year. I want my first date of the year to be 1. February. This measure comes handy if you need to calculate the fiscal year.
_DATESYTD =
CALCULATE (SUM ( tblSales[Sales] ), DATESYTD ( tblSales[Date], "01-31"))


Comments