
SSRS: Grouped Report with Drilldown
- Marek Vavrovic
- Aug 28, 2021
- 2 min read
Demo: What do I want to create:

Data source: connection to NorthWind database
Dataset:
Select c.Country,
c.City,
c.CompanyName,
SUM(od.Quantity) Quantity,
SUM(od.UnitPrice) UnitPrice
from Customers c
inner join Orders o
on c.CustomerID = o.CustomerID
inner join [Order Details] od
on od.OrderID = o.OrderID
group by Country,City,CompanyName
order by Country,City
Step 1:
ADD PARENT GROUP COUNTRY
Create a basic report by inserting a table and drag couple of fields in.
Create Group by Country:
Go to Row Groups.
Add Parent Group...
Add group header to create a stepped report.

Step 2:
ADD CHILD GROUP CITY
Go to Row Groups again to add another group for city.
Right click on the Country group and add a Child Group City with Add group header checked.

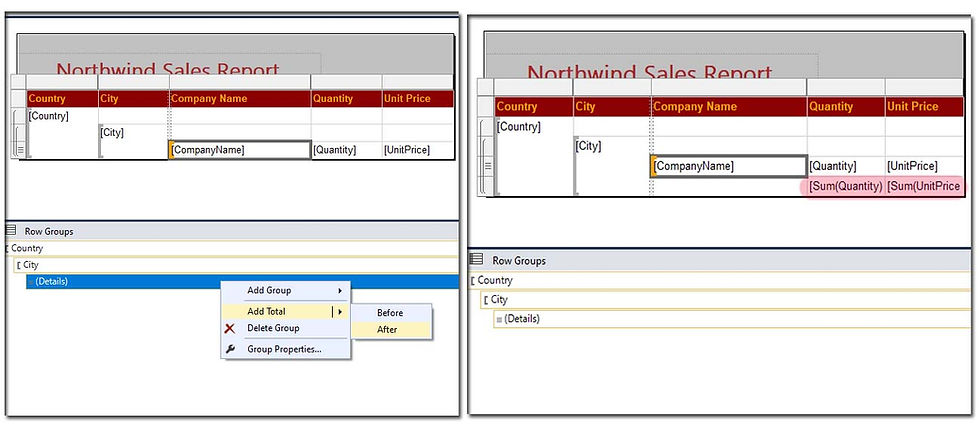
Step 3:
ADD SUBTOTAL BY CHILD GROUP CITY
Go to Row Groups, right on the Details, Add Total > After
I have created two groups: Country and city. This will add the total for the Child Group City
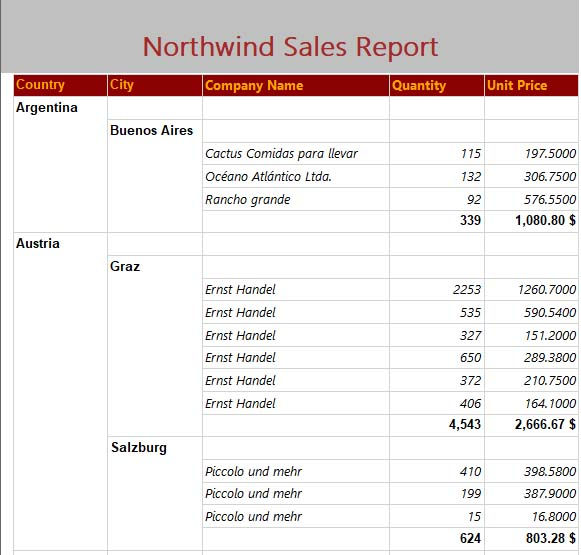
Report:
It looks like a subtotal by Company, but I haven't created a group for this field. This is de facto a subtotal by City. Next subtotal will be for Country and the third one will be the grand total.
Step 4:
you can add a simple expression to write Total by city
In the Category click on the Fields(Dataset1). Drag City field into expression builder.

Report

Step 4:
Add sub total for the Parent Group Country.
Right click on the City > Add Total > After

Report:
I want to add the drilldown. I can do it by hiding the details [azure background] by the City value.

Step 5:
Add Drilldown functionality to Details.
Go to Row Groups > Right click Details > Group Properties
Go to Visibility tab
When the report is initially run: HIDE
Display can be toggled by this item: City

Report:
The Details are hidden, you can toggle it by City field [+]

Step 6:
Add Drilldown functionality to City.
I want to HIDE City Group and UNHIDE by Country Group.
Right click on the City Group > Group Properties.
Set up the Visibility tab.

Report
Comentários